
A cloud over the Mediterranean can change its mind in the time it takes a kettle to boil. From a kitchen window the change may be imperceptible. From a weather desk, a succession of images can reveal that the harmless looking tuft at the edge of one frame has grown sharply upwards by the next. Europe’s MTG-I2 weather satellite has now demonstrated how much of that interval a forecaster can see. Its first rapid sequence returns to Europe and North Africa every two and a half minutes. At that pace an hour contains twenty four chances to notice that something has changed.
On November 6, the European Space Agency released early imagery from the second imager in its Meteosat Third Generation programme. The most revealing exhibit was a sequence covering 45 hours from November 3. Low cloud lingered over central Europe, storm clouds grew over the Mediterranean and layers of cloud travelled in different directions above the Atlantic. On the first day a plume of smoke appeared over central Portugal. The people operating the instrument had set out to demonstrate a new camera. The atmosphere supplied a remarkably varied audition.
For a Nigerian reader there are two stories inside that announcement. One concerns a European engineering achievement with consequences well beyond Europe. The other concerns a word that deserves closer attention whenever somebody promises satellite coverage of Africa. Which part? The rapid service described by ESA covers Europe and North Africa. Its companion imager provides the wider hemisphere view every ten minutes. A picture that contains the continent and a service that revisits your particular town every two and a half minutes are quite different things to put on a weather desk.
Why the weather satellite takes another picture so soon
Consider two still photographs of the same patch of sky ten minutes apart. A patch of high cloud in the first has become a broad white shield in the second. Several quite different stories could connect those frames. A growing storm may have produced the cloud locally. Wind may have carried the edge of an established system into the scene. Several small clouds may have merged. The stills establish that something changed. The missing frames contain clues about how it happened.
A shorter interval improves the chance of matching the same feature from one image to the next. That matters particularly when several bright objects occupy the same region. In a long gap, one cloud can disappear, another can form and the analyst can mistake succession for travel. Think of a football match photographed once every ten minutes. You might work out which team dominated possession. Reconstructing the pass that split the defence would require a generous imagination and a commentator with very little shame.
Two and a half minutes brings another advantage. An observer can begin to distinguish a persistent trend from a brief excursion. A cloud top that cools in one image is interesting. A sequence of successive images showing continued cooling and expansion gives the forecaster a different basis for judgement. That still leaves plenty of room for error. It does, however, let the next decision rest on a history of movement instead of a comparison between two widely separated impressions.
This kind of observation is especially valuable for nowcasting, the business of describing what is happening and what is likely to happen over the immediate future. It is a different job from deciding whether a family should pack an umbrella for a holiday next Thursday. The forecaster might have an airport expecting a wind shift, a port moving containers or a community preparing an outdoor event. Ten extra minutes acquired at the weather desk can be worth having. Ten extra minutes consumed somewhere between that desk and the recipient are exceptionally easy to lose.
A camera that keeps the same neighbourhood in view

MTG-I2 observes from geostationary orbit, about 36,000 kilometres above Earth. A satellite in this special orbit travels around the equator in the same direction and at the same angular rate as the rotating Earth. To someone on the ground it appears to stay in the same part of the sky. The apparent stillness is an achievement involving a great deal of movement. If the spacecraft actually stopped moving, the weather forecast would rather quickly cease to be its most pressing concern.
The practical advantage is continuity. A low orbiting satellite can deliver exceptionally useful observations as it passes overhead, then go on its way. A geostationary imager keeps a large part of the world in sight. Operators can decide how much of the visible disc to scan and how frequently to return to a smaller portion. In the Meteosat arrangement, two imagers allow different priorities to coexist. One supplies the broad context while the other returns more frequently to a selected area. Nobody has to persuade the atmosphere to wait its turn.
There is a price for that fixed viewpoint. Distance affects the detail a sensor can resolve, and the curved surface presents different angles depending on where you are looking. A feature near the edge of the visible Earth is viewed obliquely. Tall clouds can appear displaced against the ground beneath them. If an analyst needs to locate a cloud relative to a particular town, that geometry matters. A geostationary image is a measurement from a particular position in space, however natural the familiar curved Earth looks on a screen.
That point is easy to miss because the imagery has become so recognisable. A swirling cloud mass off a coastline appears self explanatory. The reliable interpretation may depend on the scan time, viewing angle, wavelength, projection and corrections applied. Professional products carry information about such matters. A beautifully cropped social media image often arrives without any of it. Both are pictures of the same storm. Only one is ready to answer the questions a professional forecaster is likely to ask.
What the first sequence actually shows
The Atlantic provided one especially instructive detail. In the ESA description, clouds at different levels travelled in opposite directions. To a casual viewer the image can look almost indecisive, as though the weather had forgotten which way to go. The explanation is straightforward. Winds can have different speeds and directions at different heights. A sequence lets an observer follow separate features through time. An individual frame flattens the scene and conceals much of that motion.
Central Europe offered a gentler example. Low cloud and fog persisted while other parts of the scene evolved around them. Persistence is itself information. A patch that holds its position when higher cloud moves through is a candidate for a closer look. Changes in sunlight, local topography and the properties of the air near the ground all matter to what happens next. The weather satellite supplies a regional view of the pattern. A surface observer may be better placed to say whether a driver can see the end of the road.
Over the Mediterranean, growing convective clouds made the benefit of rapid observations easier to appreciate. Convection involves air rising, often producing clouds as it cools and moisture condenses. Some growing clouds develop into thunderstorms, while others lose their supply of rising air and fade. A forecaster watching a sequence can follow the growth, the changing shape of the upper cloud and its relationship to neighbouring cells. An image can flag a situation that deserves attention before it can identify precisely who on the ground will experience severe weather.
The smoke plume in Portugal illustrates a fourth use of the same instrument. A sequence can help establish where a plume first became visible and which way it travelled. The ability to see smoke depends on its thickness, the background, illumination and cloud cover. A failure to see it offers little reassurance in unsuitable conditions. A public agency looking for the origin or the consequences of a fire would combine the imagery with local reports and other observations. The early release showed a visible plume. It did not establish everything anybody might wish to know about the fire below.
The sixteen ways a camera can look at one scene
The Flexible Combined Imager measures radiation in sixteen spectral channels. The familiar colours seen by human eyes occupy only part of the available range. Other channels respond to wavelengths we cannot see. Surfaces, cloud particles and gases interact differently with radiation at different wavelengths. Combining those measurements gives meteorologists ways of distinguishing features that might look very similar in an ordinary photograph. A white patch is a useful beginning. Knowing what sort of white patch it represents is usually more helpful.
Consider the difference between reflected sunlight and radiation emitted by the scene itself. A daytime image constructed from reflected light can show intricate textures. Once the area passes into darkness the sunlight that made those textures visible has gone elsewhere. Infrared measurements can still provide information at night. A product appropriate for an afternoon observation may therefore give way to another presentation after sunset. The weather satellite keeps working while the human idea of what counts as a recognisable photograph becomes less useful.
Colour in a scientific composite has to be read with the legend that accompanies it. An analyst might assign measurements from three different channels to the red, green and blue components of a display. A resulting colour can help distinguish a feature even though a person standing underneath it would describe it quite differently. There is nothing deceptive about the technique when it is explained. Trouble begins when an image designed for a particular diagnostic task is reposted as if it were the view from an extremely high window.
There is also a distinction between seeing something and measuring the precise quantity someone wants. A bright high cloud can cover a substantial area while the heaviest rain reaches a considerably smaller patch of ground. Different assumptions connect cloud properties to rainfall. Rain gauges and radar, where available, offer additional evidence. A good weather service knows how to bring these observations into conversation. A less useful one presents an impressive satellite loop and leaves every viewer to improvise a private theory about the next downpour.
What the satellite sees from Africa
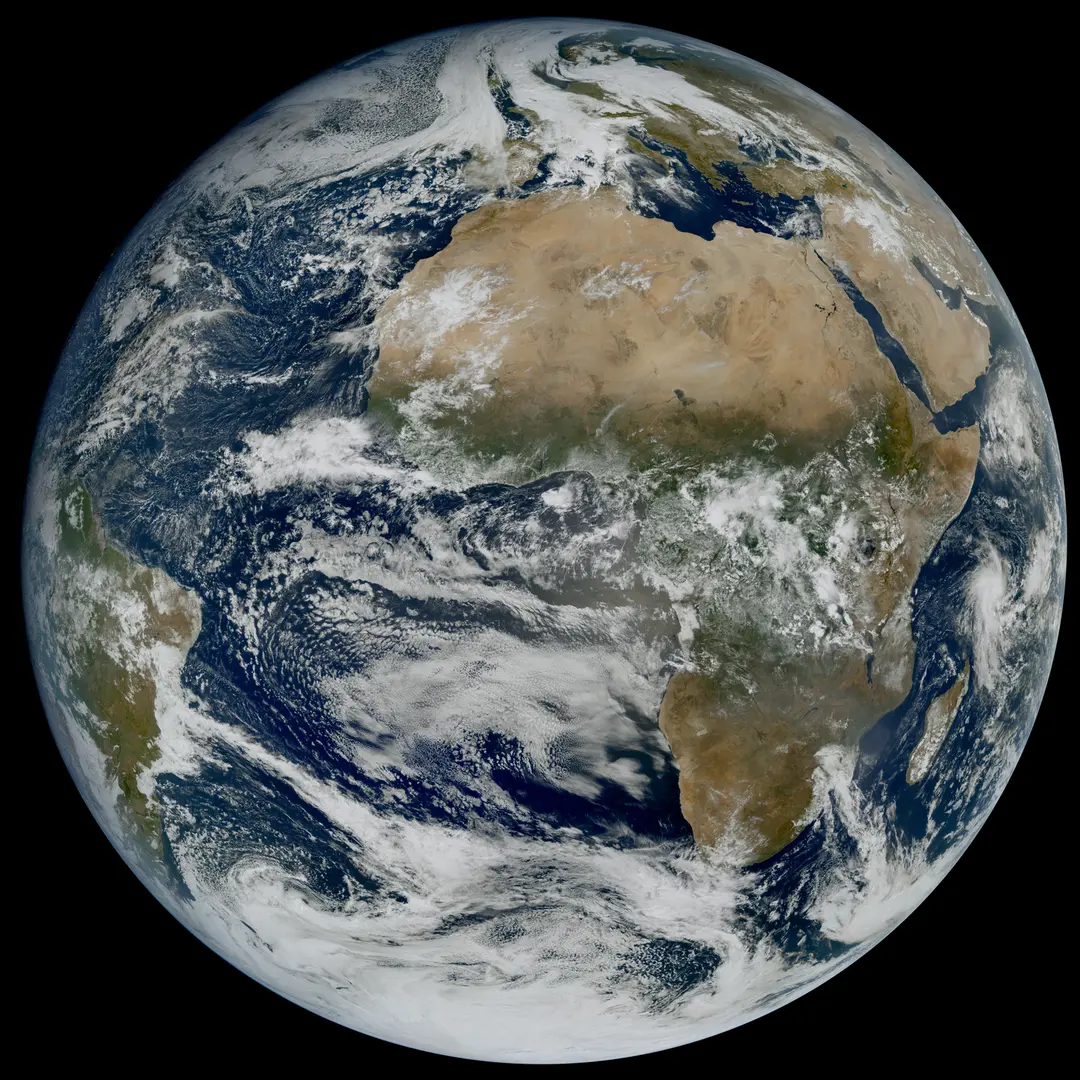
The full-disc image captured on October 20 at 10:45 UTC offers a useful starting point for understanding the geography. EUMETSAT identifies it as the Flexible Combined Imager's first full-disc image from MTG-I2. A reader can inspect Africa and Europe in the same frame and appreciate the scale covered by a single geostationary view. The separate rapid sequence released in November covers a smaller area. One image demonstrates the breadth of the imager's view. The sequence demonstrates the frequency available when the instrument concentrates on a portion of it.
For West Africa, the ten minute hemisphere view from the first imager provides the important comparison. Weather systems and their environments extend far beyond national borders. Before deciding what may happen at a particular location, a forecaster wants to know what has been developing upstream, out at sea and across neighbouring countries. A wider image taken at a slower interval can answer questions a tighter, faster image cannot. You need to know what is approaching the edge of the frame as well as what is already inside it.
For North Africa the rapid scan has a more direct significance. A weather system over the Mediterranean may affect communities on either shore. The same sequence can show features moving between maritime and continental environments without an artificial break at a political boundary. That observational continuity does not itself ensure equal access to data, staff training or warning systems. It does make it possible for weather services discussing the same developing situation to refer to the same sequence of measurements.
The European mission also helps put West Africa's own ECOSAT-1 project in perspective. The regional proposal reviewed in Abuja concerns Earth observation with a different set of imaging priorities. A very detailed view of a damaged bridge and a frequent view of a growing storm answer different questions. On a flood desk the two might eventually sit side by side. One could help explain where heavy weather is developing. The other could help assess what happened to the land and infrastructure afterwards. Choosing between them as if they were rival mobile phone cameras would miss most of the point.
Why the first image is only the beginning

ESA says MTG-I2 is undergoing calibration and validation, with operational service expected in the second quarter of 2027. That interval may surprise anyone accustomed to buying a camera, charging its battery and immediately photographing lunch. An instrument intended to support public weather services has obligations a lunch photograph can safely neglect. The readings have to be consistent across the image, comparable from one day to the next and delivered with a well understood account of their accuracy.
Calibration connects the instrument's response to a physical quantity. Validation asks how well the resulting observations or products perform when compared with suitable independent evidence. Location matters alongside brightness. If a perfectly measured feature is consistently plotted several kilometres from its real position, the result can be a poor guide to the place where someone should act. A coherent set of small errors is particularly troublesome because a picture can look reassuringly tidy while those errors persist.
Continuity presents a different challenge. An established forecasting system may already use measurements from an earlier spacecraft. Any difference in the new measurements has to be understood before it can safely be interpreted as a change in the weather. For climate applications the requirement becomes more demanding still. Researchers studying a long record need to separate changes in the environment from changes in the devices used to observe it. The first image is evidence that the instrument can see. The work after first light establishes how much confidence to place in what it measures.
A useful public account of commissioning would explain delays and uncertainties in those terms. A schedule that changes because engineers are investigating a small discrepancy can be frustrating. Finding the discrepancy before operational dependence begins is exactly what commissioning is for. The proper questions are whether the team understands the problem, whether the service has a reliable alternative while it is resolved and what the tests must show before responsibility passes to the operational organisation.
Three clocks between an observation and a warning
The first clock measures the interval between observations. The second measures how long the observation takes to reach a forecaster in usable form. The third measures how long the warning takes to reach someone who can act. Headlines naturally favour the first clock. It comes with a wonderfully precise number, two and a half minutes. A community experiences the combined result of all three, along with whatever time it needs to do something useful after the message arrives.
Imagine a harbour deciding whether to suspend a particular operation. A forecaster sees a developing storm and passes an assessment to the relevant service. Someone at the harbour has to receive it, understand which part of the waterfront is affected and relay a decision to workers who may be busy, outdoors and surrounded by machinery. Each link can function perfectly on paper while the actual warning is lost in an overflowing inbox. A briefing that reaches one responsible person promptly can matter more than a dozen attractive public dashboards.
Public confidence is part of this chain. A warning with no visible effect may later be remembered as a false alarm, even where the risk was real and the community was fortunate. Repeated exaggerated language can undermine a service. So can a reluctance to admit uncertainty until an event is almost certain and the opportunity to act has passed. Rapid imagery gives forecasters more frequent evidence on which to update an assessment. It does not relieve institutions of the difficult business of deciding how to explain probabilities in plain words.
People also need different levels of detail. An airline operations desk may want technical information that would be entirely unhelpful to a parent deciding whether to collect a child early. A local radio presenter needs a place name, a time window, a trustworthy source and a clear description of what listeners should do. Translating the same underlying observations for different audiences takes skill. The cost is modest compared with the machinery in orbit. The effect on the usefulness of that machinery can be considerable.
Reading a weather loop without fooling yourself
Begin with the time labels. A loop that runs for ten seconds on a screen may compress many hours. A cloud racing across a country in the animation may be moving at an entirely ordinary speed in the atmosphere. Look next at the gaps between frames. Missing observations or a change in sampling interval can make a feature appear to accelerate. A reliable sequence labels the original observation times. Downloaded clips with the information cropped away deserve a little more caution.
Then watch the coastline. It supplies a fixed reference against which the movement of a cloud becomes easier to judge. Choose a distinctive feature and follow it through several frames. Ask whether the cloud is travelling, growing or being replaced by another cloud in a nearby location. A storm system can move in one direction while new growth along its edge gives the whole pattern a different apparent motion. Following a single bright point can be surprisingly misleading.
Finally, notice where the loop begins and ends. The eye loves a story with a climax. An animation that ends while a storm is growing can leave a powerful impression that it went on growing indefinitely. One that starts after the most intense stage can make the event look less serious than it was. Both impressions may reflect nothing more mysterious than an editor's choice of clip length. Look for later observations, official bulletins and reports from the ground before drawing conclusions about the outcome.
This discipline matters far beyond the weather desk. Images from space carry an air of final authority, partly because so few of us can independently visit the place from which they were taken. Their real strength lies in the questions they make possible and the way their answers can be tested against other evidence. A frame is evidence about a place at a time, gathered by an instrument with known properties. Keep those qualifications attached and the view becomes more valuable, even as it loses some of its mystery.
The hardest minute to save

MTG-I2 launched on August 27. ESA developed it through Thales Alenia Space against requirements set by EUMETSAT in consultation with national meteorological services. Those institutions now have the less glamorous task of making an extraordinary stream of measurements feel ordinary to the people who use it. An operational forecaster should be able to find the latest image, understand its quality and recognise an interruption without needing to telephone a spacecraft engineer. The best infrastructure usually becomes most visible on the day it stops working.
For the public, the first images offer a rare opportunity to see the system before that familiarity sets in. Look over the Atlantic and watch different layers go their separate ways. Follow the fog that declines to move on anybody's schedule. Notice how small a beginning a growing cloud can have. There is genuine pleasure in watching the atmosphere reveal itself at a pace the eye can follow, even for someone with no professional reason to worry about anything more pressing than the washing on the line.
The achievement is already substantial. Engineers have demonstrated a faster returning view over a defined region and released enough of the sequence for people to see what the extra frames buy. The most important assessment will come during service, when a forecast office has an awkward decision to make and an extra observation arrives in time to matter. The weather satellite can promise the next look. Turning it into a warning that reaches the right person while there is still time to act remains a very human job.
See ESA’s first images and animation, EUMETSAT’s image record and Astra Planet’s companion feature on ECOSAT-1.
The conversation
0 comments
Join the discussion with a thoughtful response.